构建知识图谱
在本指南中,我们将介绍基于非结构化文本构建知识图谱的基本方法。构建的图谱可以作为 RAG 应用程序中的知识库使用。
⚠️ 安全须知 ⚠️
构建知识图谱需要对数据库执行写入操作。这样做存在固有的风险。在导入数据之前,请确保验证和验证数据。有关一般安全最佳实践,请参阅此处。
架构
从文本构建知识图谱的高级步骤如下:
- 从文本中提取结构化信息: 使用模型从文本中提取结构化的图谱信息。
- 存储到图数据库: 将提取的结构化图谱信息存储到图数据库中,以便在后续的 RAG 应用程序中使用。
设置
首先,获取所需的软件包并设置环境变量。在这个例子中,我们将使用 Neo4j 图数据库。
%pip install --upgrade --quiet langchain langchain-community langchain-openai langchain-experimental neo4j注意: 你可能需要重新启动内核以使用更新的软件包。在本指南中,默认使用 OpenAI 模型。
import getpass
import os

os.environ["OPENAI_API_KEY"] = getpass.getpass()

# 取消下面的注释以使用 LangSmith。非必需。
# os.environ["LANGCHAIN_API_KEY"] = getpass.getpass()
# os.environ["LANGCHAIN_TRACING_V2"] = "true"
接下来,我们需要定义 Neo4j 的凭据和连接。按照这些安装步骤 (opens in a new tab)设置 Neo4j 数据库。
import os

from langchain_community.graphs import Neo4jGraph

os.environ["NEO4J_URI"] = "bolt://localhost:7687"
os.environ["NEO4J_USERNAME"] = "neo4j"
os.environ["NEO4J_PASSWORD"] = "password"

graph = Neo4jGraph()
LLM 图转换器
从文本中提取图数据可以将非结构化信息转换为结构化格式,从而实现对复杂关系和模式的深入洞察和更高效的导航。LLMGraphTransformer通过利用 LLM 解析和分类实体及其关系,将文本文档转换为结构化图文档。选择 LLM 模型会显著影响输出,从而确定提取的图数据的准确性和细微差别。
import os

from langchain_experimental.graph_transformers import LLMGraphTransformer
from langchain_openai import ChatOpenAI

llm = ChatOpenAI(temperature=0, model_name="gpt-4-0125-preview")

llm_transformer = LLMGraphTransformer(llm=llm)
现在我们可以传入示例文本并检查结果。
from langchain_core.documents import Document

text = """
Marie Curie, was a Polish and naturalised-French physicist and chemist who conducted pioneering research on radioactivity.
She was the first woman to win a Nobel Prize, the first person to win a Nobel Prize twice, and the only person to win a Nobel Prize in two scientific fields.
Her husband, Pierre Curie, was a co-winner of her first Nobel Prize, making them the first-ever married couple to win the Nobel Prize and launching the Curie family legacy of five Nobel Prizes.
She was, in 1906, the first woman to become a professor at the University of Paris.
"""
documents = [Document(page_content=text)]
graph_documents = llm_transformer.convert_to_graph_documents(documents)
print(f"Nodes:{graph_documents[0].nodes}")
print(f"Relationships:{graph_documents[0].relationships}")
输出结果如下所示:
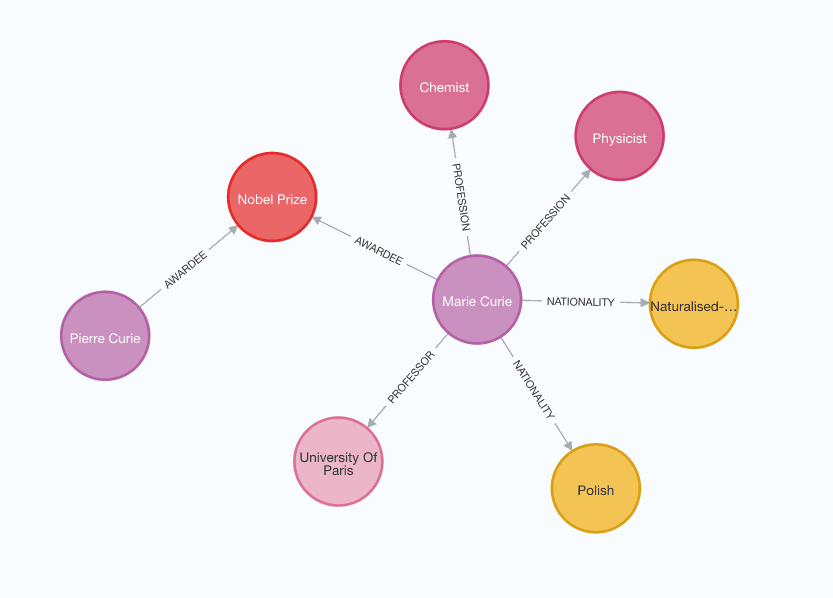
Nodes:[Node(id='Marie Curie', type='Person'), Node(id='Polish', type='Nationality'), Node(id='French', type='Nationality'), Node(id='Physicist', type='Occupation'), Node(id='Chemist', type='Occupation'), Node(id='Radioactivity', type='Field'), Node(id='Nobel Prize', type='Award'), Node(id='Pierre Curie', type='Person'), Node(id='University Of Paris', type='Organization')]
Relationships:[Relationship(source=Node(id='Marie Curie', type='Person'), target=Node(id='Polish', type='Nationality'), type='NATIONALITY'), Relationship(source=Node(id='Marie Curie', type='Person'), target=Node(id='French', type='Nationality'), type='NATIONALITY'), Relationship(source=Node(id='Marie Curie', type='Person'), target=Node(id='Physicist', type='Occupation'), type='OCCUPATION'), Relationship(source=Node(id='Marie Curie', type='Person'), target=Node(id='Chemist', type='Occupation'), type='OCCUPATION'), Relationship(source=Node(id='Marie Curie', type='Person'), target=Node(id='Radioactivity', type='Field'), type='RESEARCH_FIELD'), Relationship(source=Node(id='Marie Curie', type='Person'), target=Node(id='Nobel Prize', type='Award'), type='AWARD_WINNER'), Relationship(source=Node(id='Pierre Curie', type='Person'), target=Node(id='Nobel Prize', type='Award'), type='AWARD_WINNER'), Relationship(source=Node(id='Marie Curie', type='Person'), target=Node(id='University Of Paris', type='Organization'), type='PROFESSOR')]
可以查看以下图像以更好地理解生成的知识图谱的结构。
请注意,图构建过程是非确定性的,因为我们使用了 LLM。因此,每次执行可能会得到略微不同的结果。
此外,你可以灵活定义节点和关系的特定类型,以根据你的需求进行提取。
llm_transformer_filtered = LLMGraphTransformer(
    llm=llm,
    allowed_nodes=["Person", "Country", "Organization"],
    allowed_relationships=["NATIONALITY", "LOCATED_IN", "WORKED_AT", "SPOUSE"],
)
graph_documents_filtered = llm_transformer_filtered.convert_to_graph_documents(
    documents
)
print(f"Nodes:{graph_documents_filtered[0].nodes}")
print(f"Relationships:{graph_documents_filtered[0].relationships}")
输出结果如下所示:
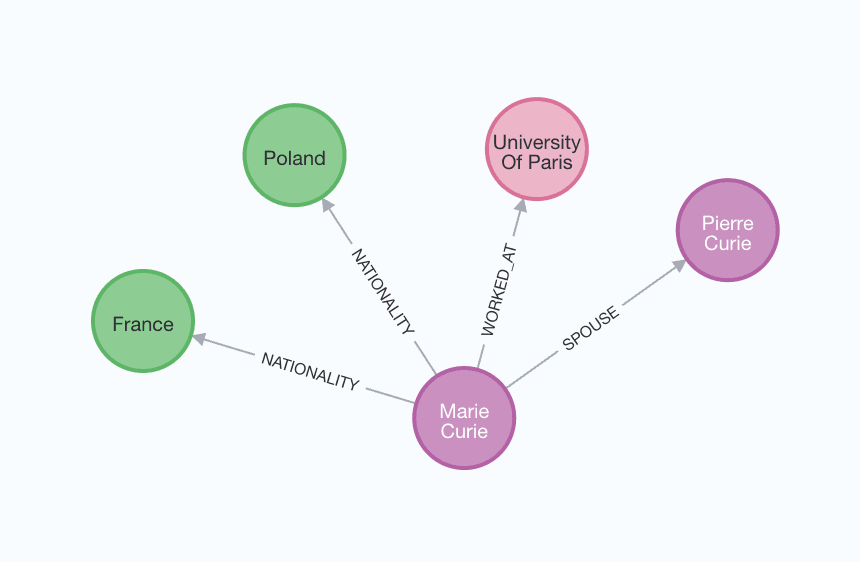
Nodes:[Node(id='Marie Curie', type='Person'), Node(id='Polish', type='Country'), Node(id='French', type='Country'), Node(id='Pierre Curie', type='Person'), Node(id='University Of Paris', type='Organization')]
Relationships:[Relationship(source=Node(id='Marie Curie', type='Person'), target=Node(id='Polish', type='Country'), type='NATIONALITY'), Relationship(source=Node(id='Marie Curie', type='Person'), target=Node(id='French', type='Country'), type='NATIONALITY'), Relationship(source=Node(id='Pierre Curie', type='Person'), target=Node(id='Marie Curie', type='Person'), type='SPOUSE'), Relationship(source=Node(id='Marie Curie', type='Person'), target=Node(id='University Of Paris', type='Organization'), type='WORKED_AT')]
为了更好地理解生成的图形,我们可以再次将其可视化。
存储到图数据库
可以使用 add_graph_documents 方法将生成的图文档存储到图数据库中。
graph.add_graph_documents(graph_documents_filtered)